The Gap Is the War
When paper prices, physical molecules, and reserve architecture tell three different stories, the distance between them is the real signal.

The Strait, the Paper, and the Molecule
The defining tension this week was the gap between financial markets pricing a short war and physical commodity markets pricing structural disruption. Oil futures sat near $107-$109 while physical crude settled at $140-$166, the widest paper-physical divergence since 2008. A two-week ceasefire announced late April 7 collapsed WTI 20% intraday, but the underlying destruction, petrochemical facilities, transport bridges, supply chains, remains intact and unresolved.
The economic backdrop hardened into a stagflationary configuration: ISM services prices hit the largest one-month spike in 13 years while employment fell sharply into contraction. Labor markets showed thinning beneath strong headlines, with household survey participation declining and U-6 unemployment rising. Private credit stress widened from theoretical to systemic, with multiple large managers gating redemptions and Moody’s downgrading the sector outlook.
The reserve currency architecture continued a slow-motion structural shift: central banks bought gold through the war rather than despite it, France completed gold repatriation from New York, and the Hormuz toll system has been codified in Iranian law, settling in yuan and Bitcoin on infrastructure the US Treasury cannot directly reach.
The paper market prices a resolution. The physical world has not received the memo.
Geopolitics: consequences for the economy and markets
The week opened with the most significant paper-physical dislocation in crude oil since 2008. Physical Dubai crude traded between $126 and $166 while Brent futures sat near $109, a spread that had been less than one dollar before February 28. The divergence is not a pricing anomaly. It is a structural read on market conviction: futures embed the assumption that the strait reopens; physical cargoes are priced on the reality that it has not.
The bypass infrastructure, the Saudi East-West pipeline at 7 million bpd, the UAE Habshan-Fujairah pipeline near capacity, covers at best 13 to 28 percent of normal Hormuz flows. The remainder, 72 to 87 percent of pre-war volumes, is absent. The bypass origin point at Habshan caught fire twice in fifteen days from intercepted missile debris. The workaround is damaged at its source.
The petrochemical destruction goes beyond oil transit. Three major processing complexes at Asaluyeh, Mahshahr, and Marvdasht have been rendered approximately 60 to 85 percent inoperable. Roughly 70 percent of Iranian steel production, required to rebuild those facilities, has been destroyed. Kharg Island, through which 90 percent of Iran’s crude exports flowed, has been struck, eliminating the revenue base for reconstruction. Ten railway and highway bridges connecting Iran’s industrial south to its ports were severed in a single day, closing the physical pathway through which reconstruction equipment would need to travel. The heat exchangers required to restart cryogenic processing are manufactured by five companies outside Iran, each weighing over 1,300 tonnes, with 18 to 36 month fabrication timelines.
The reconstruction loop has closed on itself: the facilities are destroyed, the steel to rebuild them is destroyed, the revenue to fund rebuilding is destroyed, and the transport to deliver equipment no longer exists.
The ceasefire and its limits
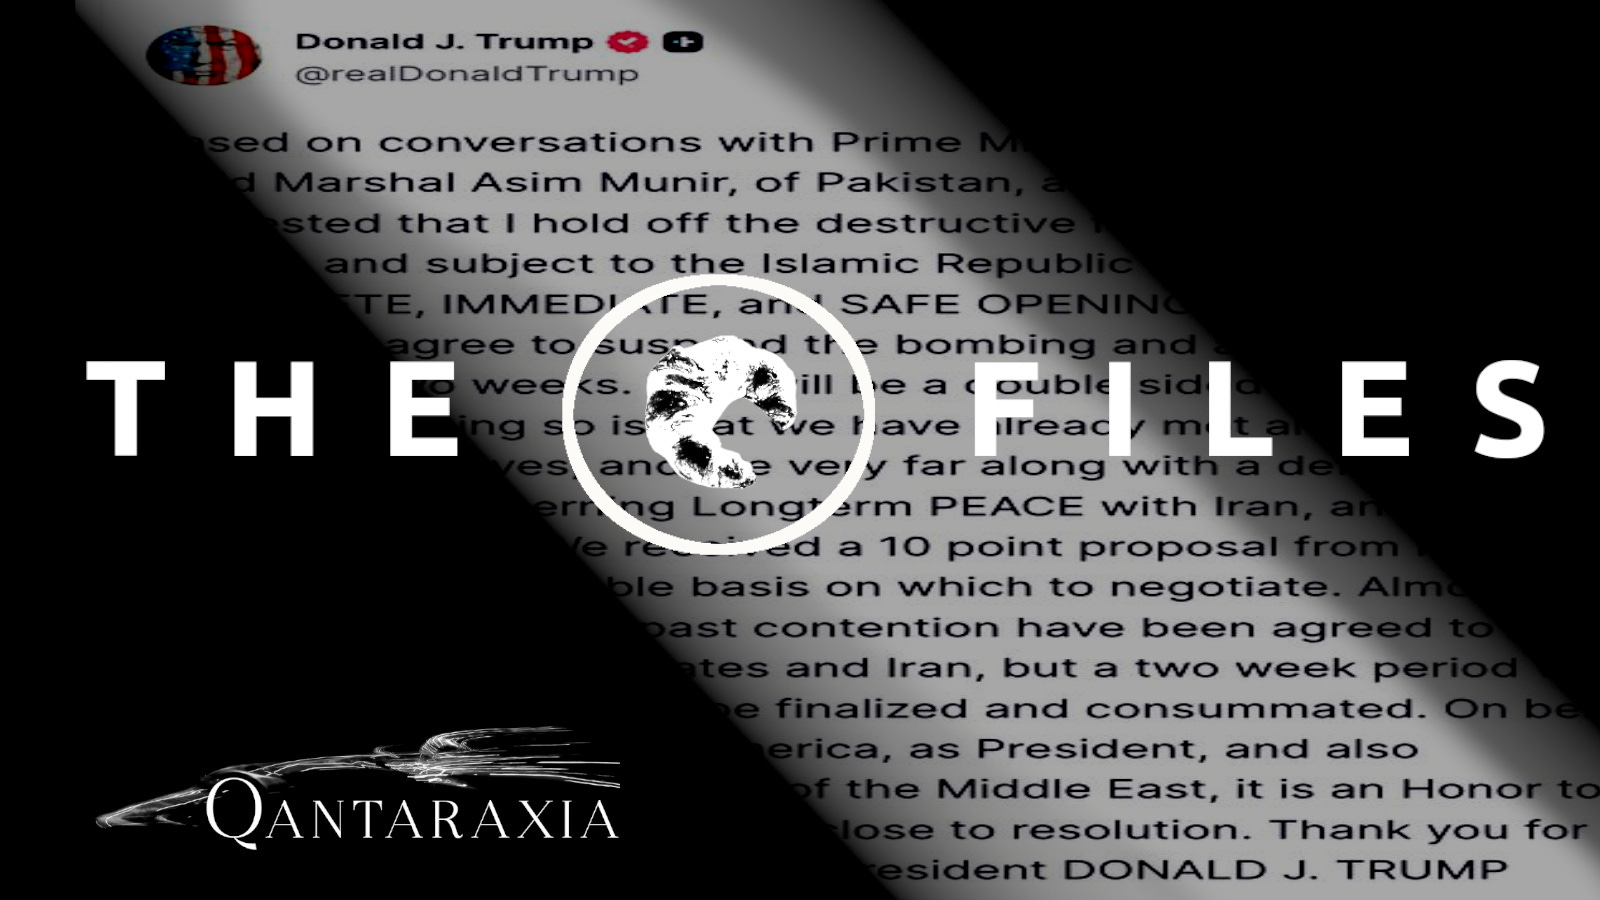
A two-week ceasefire announced by President Trump on April 7, mediated by Pakistan with Chinese pressure, briefly collapsed WTI to $96, a 20 percent intraday move.
The relief was immediate and real. Its structural content is narrower.
The ceasefire pauses kinetic activity. It does not address the legal architecture Iran has built around Hormuz control. Iran’s National Security Commission legislated the Strait of Hormuz Management Plan on March 30 and March 31, codifying permanent toll collection, Iranian military coordination of transit, and a $2 million per vessel passage fee.
That legislation predates the ceasefire and carries no sunset clause.
Within 24 hours, contradictions emerged. Oman’s transport minister publicly stated that international maritime agreements prohibit transit fees, even as ceasefire documents reported by AP and Reuters appeared to allow them. Iran told mediators it was limiting daily transit to roughly 12 ships, a sharp reversal from Trump’s characterization of a “complete opening.” By April 8, just four ships had transited for the day, fewer than any day in April. Oil prices recovered to above $95.
The ceasefire bought time, and the market briefly priced that time as resolution.
The toll architecture
The IRGC toll system is operational and documented: vessel manifests submitted to IRGC intermediaries, a one-to-five friendliness ranking, tolls of $1/barrel or up to $2 million per supertanker, payment in Chinese yuan via CIPS or USDT via Tron, a VHF passcode, and armed escort through the Larak corridor. At pre-war volumes of roughly 120 vessels per day, the $2 million per vessel structure implies potential toll revenue exceeding $87 billion annually, more than Iran’s entire pre-war oil export revenue of approximately $50 billion.
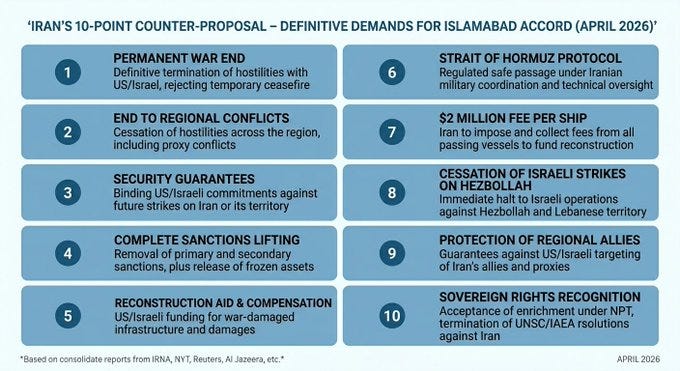
Iran’s 10-point ceasefire proposal also includes full sanctions removal, reconstruction compensation, and recognition of sovereign enrichment rights, a framework the US administration has explicitly rejected as not good enough.
The financial bypass: yuan, Bitcoin, and the dollar’s adversary
The geopolitical development with the longest financial half-life this week is the parallel payment infrastructure being built under the cover of the conflict. CIPS, China’s Cross-Border Interbank Payment System, processed over $130 billion per day in March, a 27 percent year-on-year surge. The system connects 1,600 participants across 180 countries. While 80 percent of its messaging still relies on SWIFT, the 20 percent that bypasses it entirely is the channel through which Iranian oil payments, Hormuz tolls, and ghost fleet settlements flow to Chinese refiners without US visibility.
Approximately 1.22 million barrels per day of Iranian crude is reaching Chinese teapot refineries via ghost fleet tankers operating with transponders dark, settling in yuan and cryptocurrency.
The GENIUS Act, released by Treasury Secretary Bessent on April 8, extends Bank Secrecy Act obligations to stablecoin issuers, mandating OFAC screening and wallet freeze capability. Tether has frozen $3.3 billion in sanctioned holdings under this framework.
The IRGC’s documented response is to prefer Bitcoin explicitly, a decision that has no issuer to subpoena, no compliance officer to pressure, and no freeze function. The regulation that makes USDT controllable has accelerated adoption of the rail that is not. The CLARITY Act, which would close DeFi and cross-chain bridge exemptions, remains stalled in the Senate, its floor time consumed by the war the gaps in its jurisdiction help sustain.
Economy: the stagflation configuration tightens
Services: orders strong, employment collapsing, prices surging
The March ISM Services PMI printed 54.0, a headline that reads as expansion. The composition tells a different story. Business Activity fell to 53.9. Employment collapsed to 45.2, a 6.6 point drop in a single month and the weakest print since December 2023. Supplier Deliveries rose to 56.2, a reading that looks constructive but is structurally inverted: above 50 means deliveries are getting slower, in this case due to shipping disruption, truck shortages, and Middle East conflict spillovers. The composite expanded largely because orders were robust at 60.6 and delivery friction inflated the index, not because output and hiring confirmed genuine demand strength.
Prices paid jumped to 70.7, the largest one-month increase in more than 13 years. Seventeen of eighteen service industries reported higher prices. Not one reported lower prices.
The breadth of the cost surge, simultaneous with employment contraction, is the defining characteristic of the current economic configuration. John Ryding of Brean Capital noted after the release that the prices paid reading is consistent with inflation running close to 4 percent.
The Fed’s 2026 PCE projection of 2.7 percent modeled energy transmission. It did not model services inflation stickiness driven by war-related supply friction, and the March data suggests services are transmitting the shock more slowly but more persistently than energy markets.
Manufacturing: defensive loading, not genuine acceleration
Manufacturing PMI printed 52.7, the strongest since August 2022. The internals share the same diagnostic pattern as services. Employment remained in contraction at 48.7. Prices surged to 78.3. Supplier deliveries slowed to 58.9. ISM respondent commentary described the activity as tariff uncertainty, recalibrated purchasing, supply chain vulnerability, and replacement demand. S&P Global noted firms building safety stock as war and supply delays intensified.
Transportation Equipment described 2026 as a transition year driven by capacity tightening and replacement demand. The freight and rail data confirm the same read: total rail traffic is modestly higher, chemicals at record volumes, grain elevated on export demand, but intermodal still soft, metals and construction not broadly confirming. More freight is moving in part because the system is trying to protect itself from what comes next.
Labor: thinning beneath the headline
March payrolls added 178,000, and the official unemployment rate printed 4.3 percent. The composition is significantly weaker. Health care contributed 76,000, including 35,000 physicians returning from strike disruption. Transportation added 21,000, of which 20,000 were couriers and messengers. Federal government lost 18,000 jobs. Financial activities lost 15,000.
The household survey tells a more concerning story: employment fell 64,000, the labor force fell 396,000, and the number of people not in the labor force rose 488,000. The unemployment rate fell largely because participation declined, not because employment improved. The employment-population ratio fell to 59.2 percent.
The leading indicators within the report confirm late-cycle character. U-6 rose to 8.0 percent. Marginally attached workers jumped 325,000 to 1.9 million. Discouraged workers rose 144,000 to 510,000. Long-term unemployment stood at 1.8 million, up 322,000 over the year, with 42.3 percent of the unemployed out of work for 15 weeks or more. Average weekly hours slipped to 34.2, and the index of aggregate weekly hours fell 0.2 percent. Hours reductions typically precede headcount reductions in late-cycle transitions.
Consumer: spending through weaker income
February Personal Income and Outlays showed personal income falling $18.2 billion while consumption rose $103.2 billion. The personal saving rate dropped from 4.5 percent to 4.0 percent. Real disposable income fell 0.5 percent. The income decline was led by a $39.7 billion drop in dividend income and a $21.6 billion fall in transfer receipts.
Real PCE rose only 0.1 percent despite nominal spending strength, meaning most of the apparent consumption growth was price-driven. The spending categories confirm defensive rather than confident behavior: motor vehicles, healthcare, financial services, and transportation rose; food, beverages, and recreation fell.
Q4 GDP and the narrow base of prior growth
The final Q4 2025 GDP estimate revised real growth to 0.5 percent from 4.4 percent in Q3. Current dollar GDP ran at 4.2 percent with a gross domestic purchases price index of 3.7 percent, meaning inflation carried most of the nominal growth. Three industries, wholesale trade, information, and healthcare, contributed more than the entire 0.5 percent GDP print. Transportation subtracted from growth. Service exports fell 5.7 percent. The economy entered 2026 narrowly supported, and the war-related disruption arrived against that already thin base.
Housing: the late transmission
Mortgage rates hit 6.46 percent, up 48 basis points from the pre-conflict level of 5.98 percent. Median monthly payments rose to $2,742, the first year-over-year increase since October 2025.
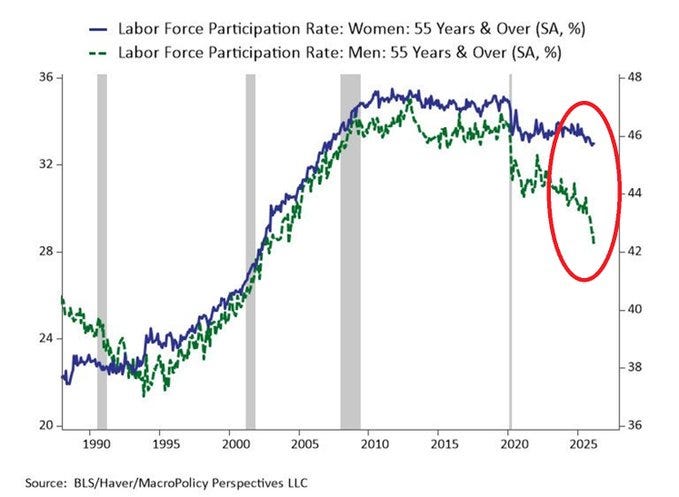
Housing prices are rising into rising rates, a configuration last seen in 2022. The structural labor shortage in construction, where the share of workers aged 55 and over nearly doubled from 11.5 percent in 2003 to 22.7 percent in 2020, and a persistent NAHB-estimated housing deficit of 1.2 million units, create ongoing cost floor pressure in the sector most sensitive to rate levels.
Private credit: from theoretical to systemic stress
Private credit stress moved from a risk-scenario discussion to live operational management this week. Carlyle Tactical Private Credit Fund received repurchase requests equal to 15.7 percent of outstanding shares in Q1, three times its 5 percent quarterly cap, and gated withdrawals accordingly. Blackstone BCRED faced $3.7 billion in Q1 redemption requests against its usual 5 percent limit, met only after the firm raised the cap to 7 percent and deployed $400 million from its own balance sheet. Barings fulfilled roughly 44.3 percent of tendered shares against a 5 percent cap. Moody’s cut its outlook on US BDCs to negative from stable on April 7, citing rising redemption pressure, higher leverage, and deteriorating funding access, and noted that non-traded BDCs recorded their first-ever outflows in early 2026 after years of strong inflows.
Jamie Dimon’s warning about private credit focuses on delayed rather than avoided losses. Looser covenants, aggressive EBITDA add-backs, payment-in-kind structures, and marks that face no daily public price discovery created the appearance of stability during a cheap-money regime. The stress transmission path runs through pension funded status, insurer capital buffers, and endowment liquidity, each of which holds private credit allocations and tends to sell liquid public assets first when private marks decline. Subchapter V small business filings rose 91 percent year-over-year in February 2026. Commercial Chapter 11 filings rose 67 percent. Total bankruptcies rose 14 percent in Q1.
The credit backdrop against which the private credit book was underwritten has shifted materially.
Markets: paper pricing, physical reality, and structural reserve shifts
Equities: squeezed from both ends
The MAG7 has lost approximately $1.1 trillion in market capitalization since the conflict began. Microsoft is 32 percent off its October peak. Meta is down 25 percent. The S&P 500 technology sector has fallen 8 percent since February 28 while the energy sector has gained 6.6 percent.
The consensus explanation, oil-driven inflation suppressing Fed cuts and compressing growth multiples, is correct but incomplete. The molecule shortage is transmitting into compute costs through packaging chemistry: Formosa Plastics declared force majeure on polymer substrates used in advanced chip packaging. Qatar’s helium supply, roughly a third of global commercial production, has been severed by Ras Laffan damage. Naphtha at $1,190 per metric tonne feeds into epoxy moulding compounds, photoresists, and ABF substrates.
The cost of computing is rising from the chemistry layer up, and no earnings model currently incorporates this transmission channel.
The US Economic Surprise Index hit 0.338, the highest since October 2023, reflecting demand that has survived better than forecast. But the Surprise Index measures how wrong analysts were about demand.
The ISM internals measure the cost of fulfilling that demand, which surged at the fastest rate in thirteen years simultaneously with collapsing employment. Companies are receiving orders they cannot profitably deliver into. Margin compression has not yet appeared in Q2 earnings but the ISM configuration describes it precisely.
Bonds: the Japan-Treasury feedback loop
Japan’s 10-year government bond yield hit 2.39 percent on April 3, the highest since February 1999. Physical Dubai crude rose from approximately $73 to $140. Gasoline hit record highs. The Bank of Japan now faces 60 to 71 percent odds of hiking at its April 27 meeting according to bond market pricing, with the yield surging 27 basis points in a month. Japan holds approximately $1.1 trillion in US Treasuries, the largest foreign holder.
When the BoJ raises rates, the incentive for Japanese institutions to hold American bonds diminishes. If Japan repatriates capital, US borrowing costs rise at the moment the United States is proposing $1.5 trillion in defense spending funded by debt. The same day Japan’s yield broke its 27-year ceiling, the US Treasury executed a $15 billion debt buyback, the largest in history, a move consistent with managing a market where the largest foreign buyer is being pulled toward domestic yield.
The Fed remains frozen at 3.50 to 3.75 percent. It cannot cut because oil-driven inflation sits above target. The BoJ cannot hold because the same shock has reached Tokyo. Two central banks at opposite positions on the rate cycle are hostage to the same 34-kilometer waterway.
Oil: the ceasefire trade and what it did not fix
WTI crashed from approximately $109 to $97.50, down 20 percent in eight hours, on the ceasefire announcement. The physical market moved but did not close the gap. Dated Brent remained at $141 on April 8 while paper sat near $107. War-risk insurance premiums for Hormuz fell below 1 percent for the first time since the crisis began, compared to the pre-war baseline of approximately 0.25 percent and peak rates of 5 percent.
The actuarial models that drove the commercial closure carry memory: they have priced in Iran’s demonstrated willingness and capability to enforce selective passage, and the two-week conditional pause has not changed the fundamental Bayesian prior for the probability of reclosure within 12 months. The post-ceasefire insurance rate remains four times normal.
The physical production destruction is not a temporary disruption. Petrochemical force majeures have been declared across ten countries with zero restarts recorded. The Dow CEO stated petrochemicals will be last in the transit queue even after the strait reopens. C&EN noted the war will debilitate petrochemicals for the rest of 2026 at minimum. QatarEnergy estimates Ras Laffan repairs at up to five years. The strait reopening does not rebuild a cracker. The ceasefire stopped the bombs. It did not change the reconstruction timeline.
Suspicious trading pattern
Reuters reported approximately 8,600 lots of Brent and WTI crude were sold at 19:45 GMT on April 7. The ceasefire was announced at 22:30 GMT, causing oil to fall 16 percent.
A structurally similar $500 million trade occurred 15 minutes before a separate Iran announcement on March 23.
CME declined to comment. The CFTC has not responded to congressional letters from Representative Torres and Senator Murphy. No public evidence links these trades to any specific party. The pattern has drawn regulatory attention without resolution.
Gold and the reserve recomposition
The world’s central banks now hold more value in gold than foreign governments hold in US Treasury securities, approximately $4 trillion in gold reserves versus $3.9 trillion in foreign-held Treasuries. This crossover occurred quietly in early 2026 and represents the most significant shift in global reserve composition since the dollar replaced sterling.
Central banks purchased 863 tonnes in 2025, the fourth-highest annual total ever recorded. Global gold ETF holdings hit an all-time high of 4,171 tonnes. The World Gold Council’s 2025 survey received 73 responses, its highest ever, with 95 percent of respondents expecting global official gold reserves to increase over the next 12 months and zero planning reductions.
The structural bid originates in the 2022 Russian reserve freeze. When the United States and Europe immobilized $300 billion in Russian central bank reserves, every non-aligned central bank received a permanent demonstration that dollar reserves held in Western institutions carry confiscation risk.
Gold cannot be frozen by executive order, does not clear through SWIFT, and answers to no foreign government.
The structural buyers this week: Poland added 20 tonnes in February, targeting 700 tonnes total. Uzbekistan added 8 tonnes, now 88 percent of its foreign exchange reserves. Kazakhstan added 8 tonnes. China added 1 tonne for its 16th consecutive month.
France completed repatriation of 129 tonnes from the Federal Reserve Bank of New York between July 2025 and January 2026. The Banque de France sold legacy non-standard bars at record prices and purchased equivalent compliant bars in Europe, booking a capital gain of 12.8 billion euros without altering its total 2,437-tonne reserve.
Germany completed the same process between 2013 and 2017. The pattern of Western central banks repatriating sovereign gold from New York custody, described publicly as operational, produces political outcomes regardless of stated motive: founding NATO allies have removed their gold from American custody. China has simultaneously reduced US Treasury holdings by $638 billion while accumulating gold for 16 consecutive months.
Gold at $4,723 on April 8 is approximately 9 percent below its January high of $5,608. JPMorgan and Wells Fargo target $6,100 to $6,300. Goldman Sachs reaffirmed $5,400 by year-end. The correction is a near-term trade driven by the dollar’s temporary strengthening through the oil-inflation channel.
The same war that is degrading the dollar’s security guarantee at Hormuz is temporarily strengthening the dollar’s price through inflation-driven rate expectations.
The dip is being accumulated by central banks, not liquidated.
The structural bid from the 2022 freeze has not reversed. The Hormuz toll booth, settling in yuan, reinforces rather than interrupts the logic of holding an asset that requires no issuer and no navy.
The convergence: three rails without dollars
The most consequential structural development of the week is the simultaneous emergence of three parallel non-dollar energy settlement channels:
The IRGC Hormuz toll settles in yuan and Bitcoin.
The Binance platform launched 100x leveraged perpetual futures on WTI, Brent, and natural gas denominated in USDT, with no physical delivery, no CME clearing, and no CFTC jurisdiction.
CIPS processed $130 billion daily in March, primarily yuan, settling Iranian crude payments between Chinese refiners and IRGC-linked intermediaries.
These three rails use the same stablecoin infrastructure, emerged in the same week, and collectively circumvent the dollar settlement system through which the petrodollar’s dominance has historically been maintained.
The petrodollar’s current 58 to 59 percent share of global reserves, and its 80 to 85 percent share of commodity trade invoicing, is not yet structurally threatened by 1.22 million barrels per day of yuan-settled Iranian crude.
The significance is not current volume. It is the existence of a functioning daily-settling alternative, operated under fire, codified in sovereign law, and hardening into permanent infrastructure, at the chokepoint through which 20 percent of global oil supply normally flows.
Thanks for reading
I’ll be traveling tomorrow (hence this report earlier than usual), and I’m not sure I’ll be able to produce one next week.
Stay tuned !
Quantaraxia believes the information contained in this material to be reliable but do not warrant its accuracy or completeness. Opinions, estimates, and investment strategies and views expressed in this document constitute our judgment based on current market conditions and are subject to change without notice.
RISK CONSIDERATIONS
All investments involve a degree of risk, including the risk of loss
Past performance is not indicative of future results. You may not invest directly in an index.
The prices and rates of return are indicative, as they may vary over time based on market conditions.
Additional risk considerations exist for all strategies.
The information provided herein is not intended as a recommendation of or an offer or solicitation to purchase or sell any investment product or service.
This material should not be regarded as investment research or a Quantaraxia research report.