Performing Peace, Pricing War
How the gap between official narratives and structural realities is quietly repricing risk across energy, capital markets, and the global settlement architecture

The central theme of this week is the widening gap between official narratives and structural realities across geopolitics, economics, and markets.
The US-Iran conflict has entered a phase where both sides are simultaneously performing negotiation and preparing further military action, with neither the ceasefire framework nor the underlying disagreements on uranium removal resolved. This ambiguity is now a direct input into energy pricing, dollar dynamics, and global supply chain planning. The depletion of US missile and interceptor stockpiles to critical levels, the resignation of both intelligence chiefs, and the pause of Taiwan arms transfers in favor of Iran operations collectively signal that Washington is managing a strategic resource constraint that the public market narrative has not yet priced.
Meanwhile, the structural deterioration in US Treasuries, the compression of defensive equity sectors to historic lows, and the concentration of S&P 500 weight into a narrow set of AI and mega-cap growth names suggest a market structure that is increasingly fragile under a surface of apparent strength.
China’s accelerating economic contraction, Japan’s failed currency defense, and the emerging architecture of settlement rails outside the dollar system add layers of systemic risk that are building slowly but consistently.
The week’s most underappreciated development may be the formal disclosure by Strategy of its capital cycle mechanics, which simultaneously validated the Bitcoin treasury model and exposed its dependence on conditions, specifically premium to net asset value and continuous capital market access, that are no longer fully intact.
GEOPOLITICS
Implications for Economy and Markets
The US-Iran conflict has produced a structural condition that matters more for portfolios than any single military event: the Strait of Hormuz has shifted from a transit corridor to a contested toll zone, and that shift is now being treated by multiple parties as permanent rather than temporary.
Iranian authorities have described the fee system on vessel transits as durable, the Persian Gulf Strait Authority has asserted jurisdiction extending into UAE territorial waters, and Iran’s ambassador to France has confirmed the toll system is not contingent on a peace deal. Pre-conflict, approximately 120 to 140 vessels transited daily. Current throughput sits below 10% of that level, meaning the insurance and logistics infrastructure that global energy markets depended upon is effectively suspended.
The financial consequences of this suspension preceded the military ones. When Iran closed the strait in late February, war-risk insurance premiums did not gradually adjust. They detonated, moving from roughly 0.25% of hull value to between 1% and 5% per transit, converting a half-million-dollar passage into a two to seven million dollar one. Eight of the twelve largest maritime protection clubs issued cancellation notices for Persian Gulf cover.
The US Development Finance Corporation subsequently built a $20 billion reinsurance facility with Chubb specifically to address this market failure, but the underlying risk that caused private underwriters to exit has not been removed. Brent crude near $98 to $110 per barrel is therefore carrying a structural premium that reflects genuine physical disruption, not speculative positioning.
The negotiation framework announced this week, a 60-day ceasefire with Hormuz reopening, sanctions relief, and 30 days of subsequent nuclear talks, has been described differently by each party:
The US version, per two American officials cited by the New York Times, includes the removal of approximately 440 kilograms of 60% enriched uranium from Iranian territory.
The Iranian version, per a senior Iranian official cited by Reuters, includes no such commitment.
Both positions appear in the same memorandum of understanding. This is not a negotiating ambiguity to be resolved later. It is a fundamental structural contradiction in the agreement itself, and it means the ceasefire framework is simultaneously a legitimate de-escalation pathway and a platform from which either side can credibly claim the other violated terms when convenient.
The military resource dimension adds another layer to the analysis. Based on reporting from CSIS, combined US and Gulf Patriot interceptor stocks are estimated between 900 and 1,200 missiles, down from roughly 3,600 pre-war. At first-week-of-March consumption rates, that inventory is exhausted in 7 to 8 days of high-intensity combat.
Separately, the Acting Secretary of the Navy testified to the Senate Appropriations Defense Subcommittee that a $14 billion arms package to Taiwan has been paused to prioritize munitions for Operation Epic Fury, citing over 1,000 Tomahawk cruise missiles and 1,200 Patriot interceptors already expended. Annual production rates cannot replace those inventories within a timeframe relevant to current operational planning. The pause creates a visible gap in Taiwan deterrence at a moment when US-China dynamics are already under pressure, and it occurred without notification to Taipei.
The Gulf states’ position has become more self-interested and less aligned with any single external power as a direct result of the conflict. An analysis published in Foreign Policy this week argued that the response from Gulf governments will not be realignment but a more disciplined, conditional foreign policy driven by the recognition that no external guarantor can fully substitute for their own strategic judgment.
This shift has concrete implications for the petrodollar architecture. China paid Iranian transit tolls in yuan this week. Iran launched Hormuz Safe, a state-backed maritime settlement platform clearing on Bitcoin confirmation rather than through dollar-denominated institutions, specifically after Tether froze $344 million of Iran-linked USDT in coordination with US enforcement in late April.
The settlement rail that cannot be frozen is now being built by a sanctioned sovereign under live fire conditions, and the Gulf states are watching the outcome.
ECONOMY
Energy and the Dollar Transmission Mechanism
The sustained elevation of Brent crude between $98 and $110 per barrel is not functioning as a conventional inflationary input. It is functioning as a tax on dollar-denominated import-dependent economies, and the transmission mechanism is different in important ways from a demand-driven commodity cycle.
When oil spikes in dollars, importers need more dollars to purchase the same essential fuel. This raises dollar demand, weakens local currencies, and makes the next barrel more expensive in domestic terms. The pressure loop moves from energy to currency to inflation to central bank response, and the endgame is not necessarily runaway inflation.
In a debt-heavy world, it is more likely to be demand destruction followed by deflationary pressure on credit, employment, and asset values.
Japan is the clearest current example of this dynamic. The BOJ intervened to defend the yen near 160, pushing USDJPY briefly to 155 to 156. Within weeks, the move had fully reversed and USDJPY is back near 159. Intervention without an accompanying policy shift is a speed bump, not a solution.
Japan imports roughly 85% of its crude from the Middle East, priced in dollars. A weak yen against elevated dollar-denominated oil creates a dual shock: higher fuel costs for households and small businesses, while the BOJ faces the structurally impossible choice between hiking rates to defend the currency, at risk to JGB markets and domestic demand, or tolerating imported inflation that erodes real wages.
Japan’s situation is not idiosyncratic. South Korea, Taiwan, India, Turkey, and the eurozone are all absorbing variations of the same dollar-oil squeeze, and the deflationary phase that follows the inflationary shock begins when energy costs stop being a price story and become a cash flow story. That transition appears to be underway.
China: Structural Contraction, Not a Cycle
China’s May data confirmed a contraction that has been building across multiple indicators for years rather than a conventional cyclical slowdown:
Retail sales posted their worst month since the COVID lockdowns.
Fixed asset investment is falling.
Housing prices are down more than 11% over three years, significant because Chinese household wealth is concentrated in property rather than financial assets.
The bond market’s response to each successive stimulus package has been to price lower rates, not as relief but as negative expectations, reflecting private sector defensive positioning rather than productive investment demand.
The argument that further rate cuts or government spending will reverse this trajectory faces a structural obstacle:
households are protecting balance sheets because property is falling and employment is uncertain,
banks are protecting margins because non-performing loans are materially understated,
and private firms are protecting liquidity because demand continues to deteriorate.
Lower rates in this environment do not create incremental borrowing. They validate pessimism.
The China contraction has global supply chain implications that are only beginning to resolve. Nvidia’s advanced H200 chips were cleared for sale to Alibaba, Tencent, and ByteDance this month, each approved for up to 75,000 units. Not one has been sold.
Beijing directed domestic firms to hold back and buy Chinese alternatives instead. Huawei and DeepSeek on domestically built hardware now command roughly 40% of China’s AI accelerator server market, up from near zero before export controls. The chip gate opened and nobody walked through, which is a more significant strategic signal than the export control itself.
It means China has achieved sufficient domestic substitution in a critical technology segment that US market access is no longer a meaningful lever. The semiconductor supply chain implications for companies whose valuations are premised on China demand are not yet reflected in consensus analyst targets.
US Fiscal and Labor Conditions
US gasoline averaged $4.51 per gallon over Memorial Day weekend, 51% above pre-war levels. This is both a household consumption tax and an inflation input that the Federal Reserve has limited tools to address without simultaneously compressing growth.
The Atlanta Fed’s GDPNow estimate for Q2 2026 was revised down from 4.3% to 3.8% this week following consumer and investment markdowns in Census and BEA data, suggesting the consumption base is narrowing even as headline growth appears resilient. The divergence between the macro aggregate and its components is increasingly characteristic of a K-shaped economy where mega-cap earnings growth coexists with credit stress across consumer credit cards, auto loans, student debt, commercial real estate refinancing, and small business failures.
The professional labor market is showing stress that had not previously been visible. Unemployment among workers under 35 with advanced degrees is rising, a cohort that had historically been insulated from cyclical labor market weakness. When credential-premium workers begin experiencing unemployment, the signal is that the contraction is no longer contained to the lower-income consumer.
The white-collar recession dynamic, if it broadens, would have direct implications for tax receipts, high-end consumer spending, and the earnings assumptions underpinning the current equity multiple expansion in technology.
Kevin Warsh was sworn in as Federal Reserve Chair this week, the first such White House ceremony since Reagan and Greenspan in 1987. Warsh has publicly called for regime change at the central bank. His confirmation passed in the closest vote in modern history.
The combination of a new Fed chair with a stated reform agenda, an administration with a demonstrated willingness to use the Fed as a policy tool, and a Treasury market already in its longest drawdown in over 100 years creates a policy environment with a wider range of possible outcomes than conventional rate path forecasting captures.
The $300 Billion Iran Reconstruction Variable
The New York Times reported this week that the proposed US-Iran peace deal includes a $300 billion international investment fund for Iranian reconstruction, described by the US as facilitated rather than funded directly.
Iran is characterizing this as reparations.
If this framework advances, the fiscal and capital flow implications are significant. A reconstruction fund of this scale would represent a sovereign credit creation event in a previously sanctioned economy, with downstream effects on oil supply normalization, regional infrastructure investment, and the reallocation of Gulf capital currently parked in dollar-denominated instruments.
It would also represent an implicit validation of the Iranian negotiating position, which the Gulf states are watching with the same attention as the military outcome.
MARKETS
Equity Markets: Concentration Risk at Historic Levels
The S&P 500 closed on May 22nd its eighth consecutive winning week, with futures briefly touching 7,524. The financial narrative treated this as confirmation of unstoppable momentum.
The Commitments of Traders report from the same week showed large speculators net short approximately 140,600 E-mini S&P 500 contracts. Polymarket’s binary contract on the index reaching 8,000 by June 30 was pricing at an implied probability of 11 to 15%.
The same week Brent crude was carrying a Hormuz war premium that equity volatility has not absorbed. All of these are simultaneously true, and they represent different admission gates on the same underlying asset. The reader who treats any one as the full picture is managing risk through a single lens.
The structural deterioration in defensive sectors is the more important signal beneath the headline index level.
The S&P 500 Utilities sector relative to the broader index has fallen to a record low ratio of approximately 0.06, declining 40% since the 2022 bear market low. Over that same period, the S&P 500 itself has risen 106% while Utilities gained only 38%.
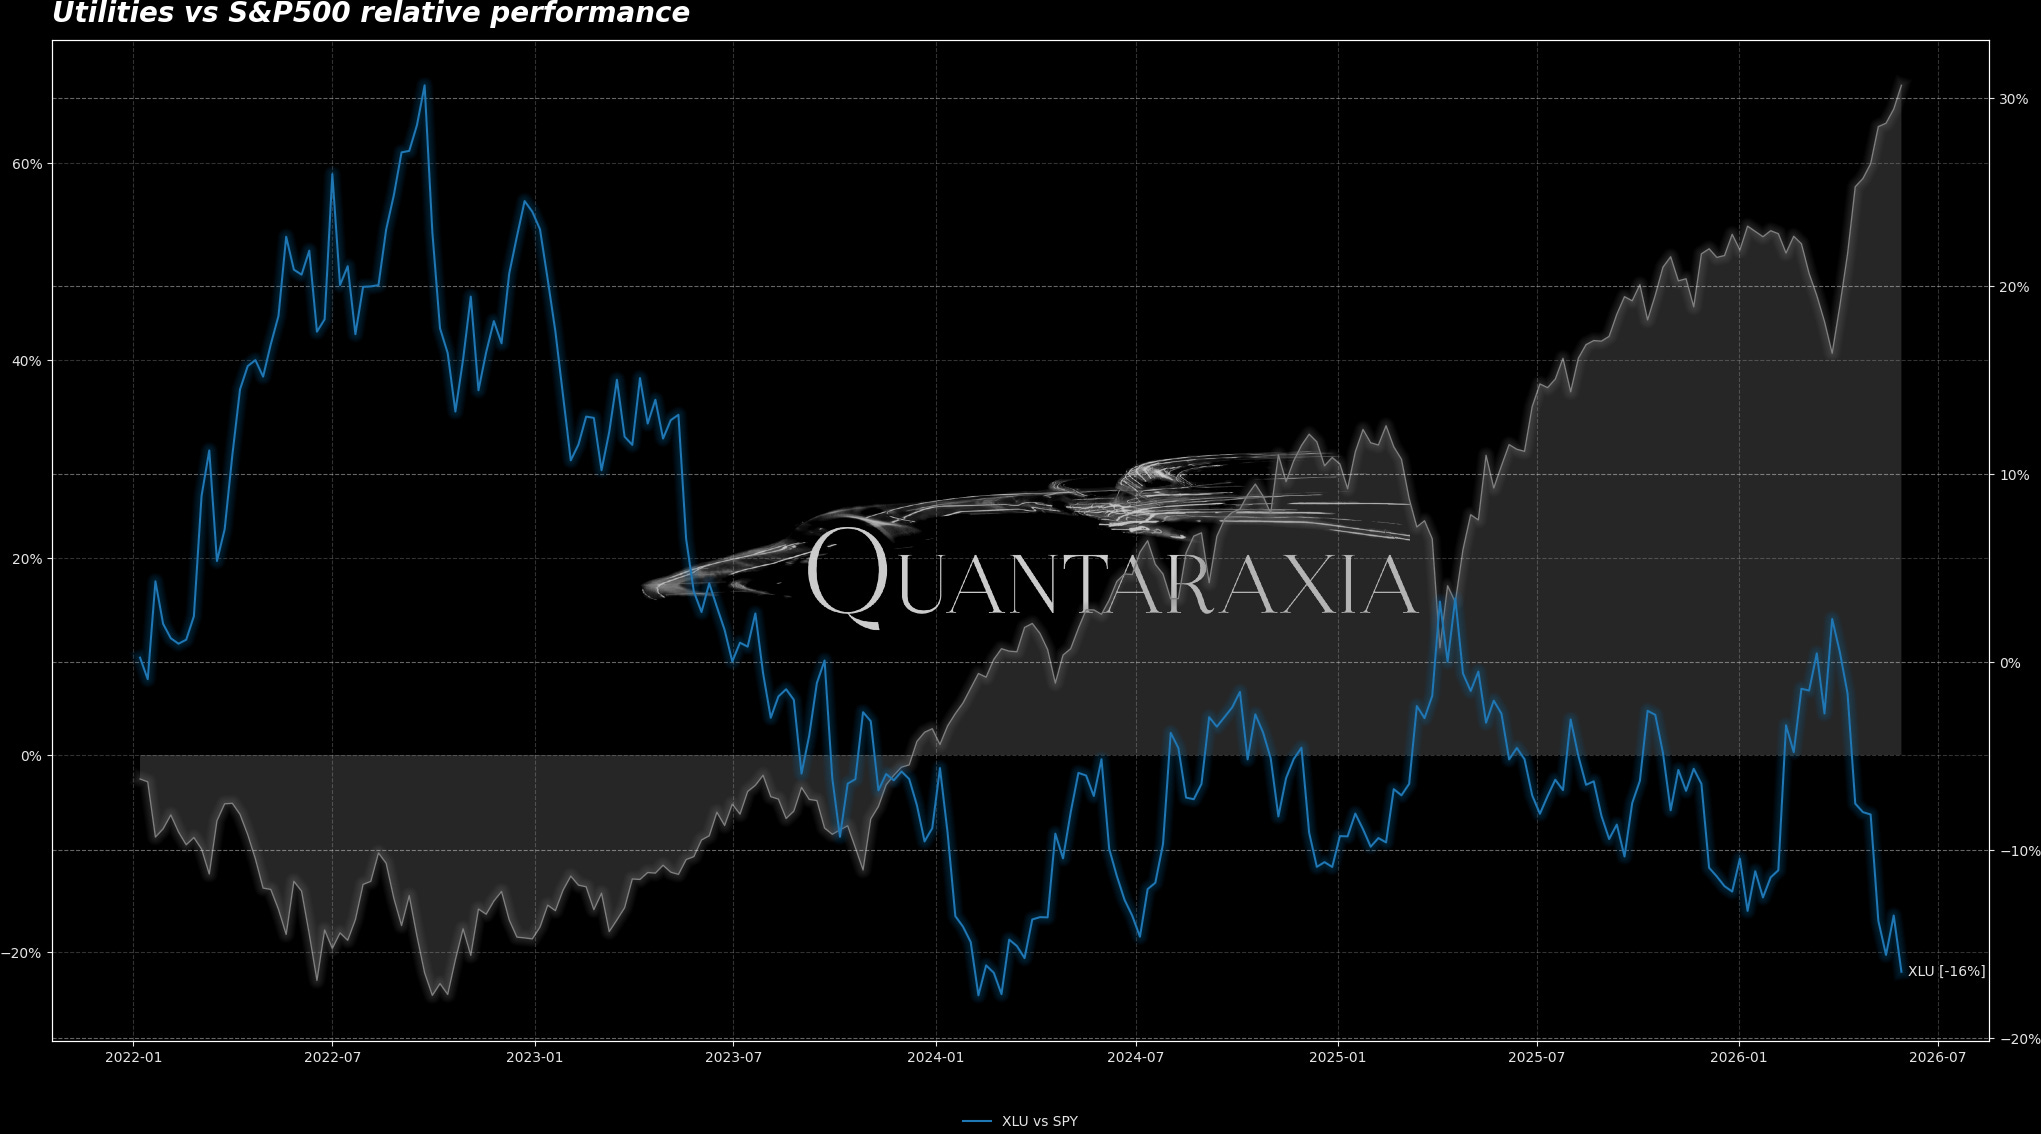
When defensive sectors, traditionally including Utilities, Consumer Staples, and Health Care, collectively represent approximately 15% of S&P 500 market cap, the index is no longer functioning as a diversified market barometer. It is functioning as a leveraged bet on mega-cap growth, technology, and AI capital expenditure. The structural parallel most frequently referenced is the late 1990s, when a genuine technology transition was simultaneously creating real productivity gains and generating extreme valuation concentration in a narrow cohort of beneficiaries.
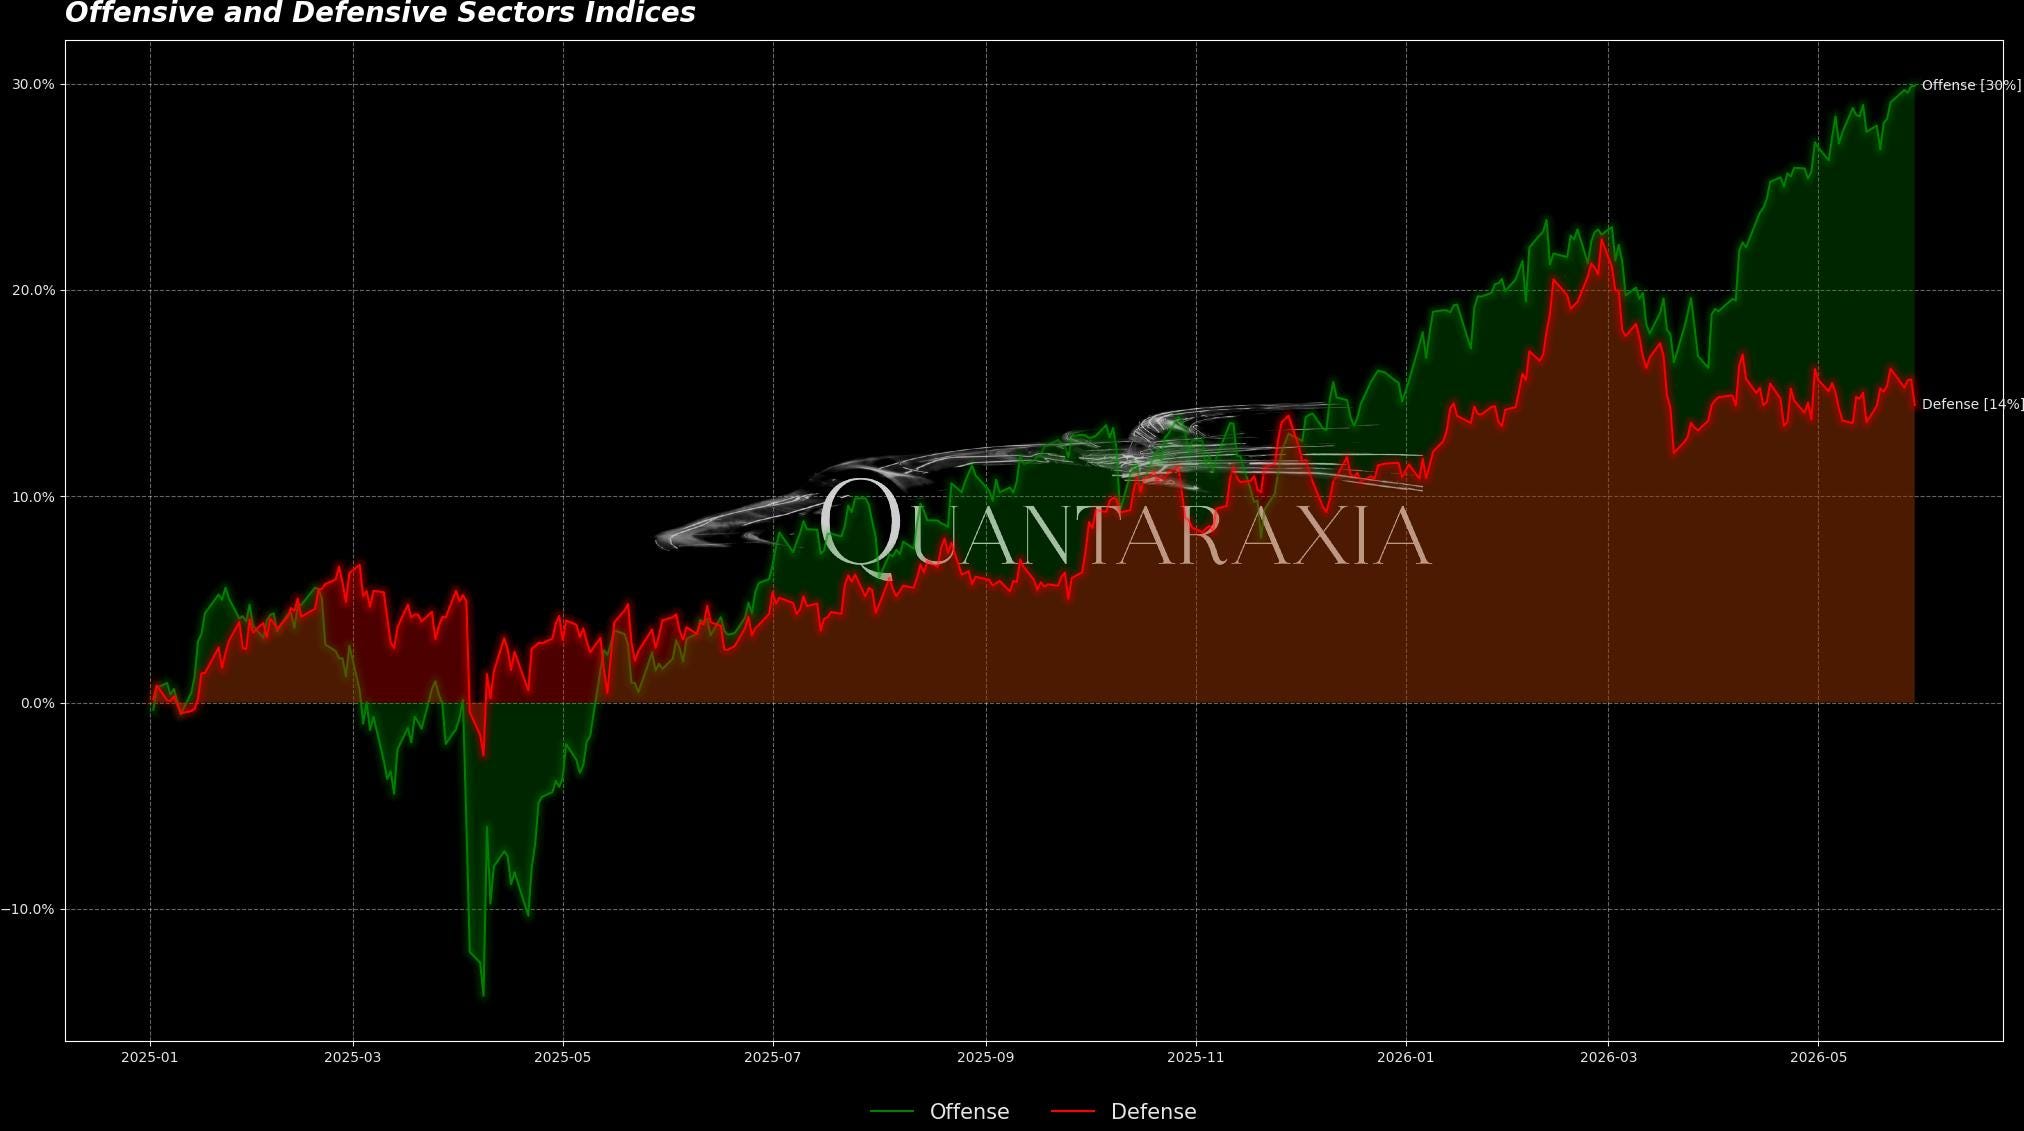
The defensive underperformance has a mechanical explanation beyond narrative. Higher yields make Utilities unattractive as bond proxies. Policy risk makes healthcare multiples uncertain. AI is drawing capital into growth at a pace that crowds everything else. But the underlying credit stress signals, consumer debt deterioration, commercial real estate refinancing pressure, small business failures, are not small market signals.
They are the components of the economy that typically precede a broader contraction. The market is simultaneously pricing them as contained and pricing mega-cap growth as if macro risk is irrelevant to earnings durability.
That is a coherent position at this point in the cycle, but it is not a hedged one.
Semiconductor Concentration and the Memory Ceiling
Semiconductors now represent approximately 18% of S&P 500 weight, the largest single industry group and more than double their dot-com peak weight. In South Korea, Samsung and SK Hynix together exceed half the national index. SK Hynix, Samsung, and TSMC collectively account for approximately 27% of the entire emerging markets index.
The world’s investment portfolios are concentrated as never before in firms whose valuations depend on a specific admissibility question: who is permitted to buy, build, and sell the most advanced chips.
The memory constraint beneath the processor constraint is the specific development that matters most this week. Only three companies manufacture high-bandwidth memory at scale. SK Hynix holds roughly 60% of that market. Every unit of HBM to be produced through the end of 2026 is already sold under binding long-term agreements.
Micron crossed one trillion dollars in market capitalization in 48 trading days from $500 billion, the fastest such doubling in history. One major bank set a target of $1,625. The consensus of analysts sits near $555. The $1,070 gap between those targets is a single disagreement: whether memory is now permanent critical infrastructure priced like a utility, or a cyclical commodity subject to the same boom-bust dynamics that have characterized it for three decades.
The 2027 supply expansion is already scheduled, which provides the commodity camp with its primary rebuttal.
The power grid constraint sits beneath the memory constraint. Logic chips build in 18 months. Memory fabs ramp in two years. Power grids do not.
US interconnection queues hold thousands of gigawatts waiting five years or more, transmission lines take up to eight years to permit and build, and approximately half of planned 2026 US data centers are expected to be delayed or canceled not for lack of capital but for lack of electricity.
The scarcity that cannot be manufactured on any timeline relevant to the current AI capital expenditure cycle is the right to be admitted to power.
Treasury Markets and the Verification Clock Problem
The US Treasury Total Return Index has been in drawdown for 69 consecutive months, the longest stretch in over 100 years of data. The previous record lasted approximately 30 months and ended in 2019. The 30-year Treasury yield touched 5.18% in the week of May 19, levels not consistently seen since before the global financial crisis.
This is not a temporary positioning adjustment. It is a structural repricing of the risk-free rate that has been building for nearly six years and has now surpassed every previous duration record.
The structural problem embedded within the private credit market is a direct consequence of this Treasury repricing. Institutional buyers purchased $1.4 billion of private loans at 99.7 cents on the dollar in February. Retail holders of equivalent credit risk, held through semi-liquid wrapper vehicles, find the exit door open 5% per quarter by contract.
Same underlying risk, two different clearing mechanisms, two different prices. The institutional block is curated, priced at the line level, and clears near par because buyers can afford to wait. The retail wrapper is modeled by its own manager, verified quarterly, and rationed at the gate when withdrawal demand exceeds the contracted limit.
Nothing here is fraud. The architecture is functioning as written. The problem is that the verification clocks run at fundamentally different speeds for different classes of investors, and when they resynchronize, the question of who holds the loss has a predetermined structural answer.
The policy machinery is currently facilitating the migration of household retirement capital toward these slower verification instruments, through a process-based safe harbor framework whose comment window remains open. If that migration occurs at scale, the concentration of retail capital in instruments that cannot clear on demand during stress conditions would represent a significant amplification mechanism in the next liquidity event.
Bitcoin and the Settlement Rail Divergence
Bitcoin fell to approximately $73,300 this week, more than 10% below its May high, on the same tape as the renewed Hormuz strikes. The institutional interpretation was a safe haven failure. The structural interpretation is different.
The sequence matters. Iran closed the strait in late February. War-risk insurance detonated and the dollar-denominated underwriting market for Persian Gulf transit partially collapsed. Tether froze $344 million of Iran-linked USDT in coordination with US enforcement in late April, demonstrating that a dollar-backed stablecoin is functionally equivalent to a dollar in terms of seizability. Iran then launched Hormuz Safe on May 16, a sovereign maritime settlement platform clearing on Bitcoin confirmation with no institutional intermediary that can be reached by Treasury enforcement.
The price action and the infrastructure logic are not the same variable. Bitcoin on institutional books is a leveraged technology proxy. Bitcoin as a settlement rail has no off switch.
These two properties coexist in the same asset and they have begun moving in different directions under the same conditions. The asset went down. The logic of the uncensorable rail went up.
For portfolios with exposure to either dimension, the distinction matters.
Strategy’s Architecture and the mNAV Signal
Strategy disclosed its capital cycle mechanics publicly this week for the first time. Michael Saylor named the “BitVac,” the company’s accumulation-pause-retire cycle, after using cash to retire $1.5 billion of 2029 convertible bonds at $1.38 billion, capturing a $120 million discount.
The disclosure was accompanied by public acknowledgment that Strategy may sell Bitcoin to pay preferred dividends and that the credit structure requires the option to sell in order to maintain its credit standing. Both statements are structurally significant because the previous premium to net asset value that drove MSTR equity was built on the opposite premise.
Strategy’s mNAV, the ratio of its market capitalization to the underlying Bitcoin value, has compressed from 3.89x in November 2024 to approximately 1.08x today, 8% above the threshold at which the company’s own disclosed playbook indicates it would begin issuing credit to repurchase equity rather than issuing equity to buy Bitcoin.
The flywheel that worked at high mNAV is mechanically different from the structure that operates at mNAV near 1.0.
At the same time, STRC perpetual preferred at 11.5% annual yield is the world’s largest preferred stock by market cap, implying the market is demanding significant compensation for the subordination, liquidity, and Bitcoin volatility risks embedded in the instrument. The $1.71 billion in annual STRC dividend obligations must be serviced in dollars regardless of where Bitcoin trades.
Thanks for reading
Quantaraxia believes the information contained in this material to be reliable but do not warrant its accuracy or completeness. Opinions, estimates, and investment strategies and views expressed in this document constitute our judgment based on current market conditions and are subject to change without notice.
RISK CONSIDERATIONS
All investments involve a degree of risk, including the risk of loss
Past performance is not indicative of future results. You may not invest directly in an index.
The prices and rates of return are indicative, as they may vary over time based on market conditions.
Additional risk considerations exist for all strategies.
The information provided herein is not intended as a recommendation of or an offer or solicitation to purchase or sell any investment product or service.
This material should not be regarded as investment research or a Quantaraxia research report.